You're on your knees under the kitchen sink at 11 p.m., flashlight in your teeth, elbow-deep in a puddle that used to be your cabinet. You've already found the shutoff valve, so the bleeding's stopped, at least.
Now you're just waiting. Checking the driveway. Checking your phone. Refreshing a booking page that has no real reason to load any faster just because you're staring at it.
Nobody tells you what "on the way" actually means in minutes.
So we checked. Our network logs two timestamps on every job: the moment a request comes in, and the moment a pro physically arrives.
Not a survey. Not a guess. Just the clock.
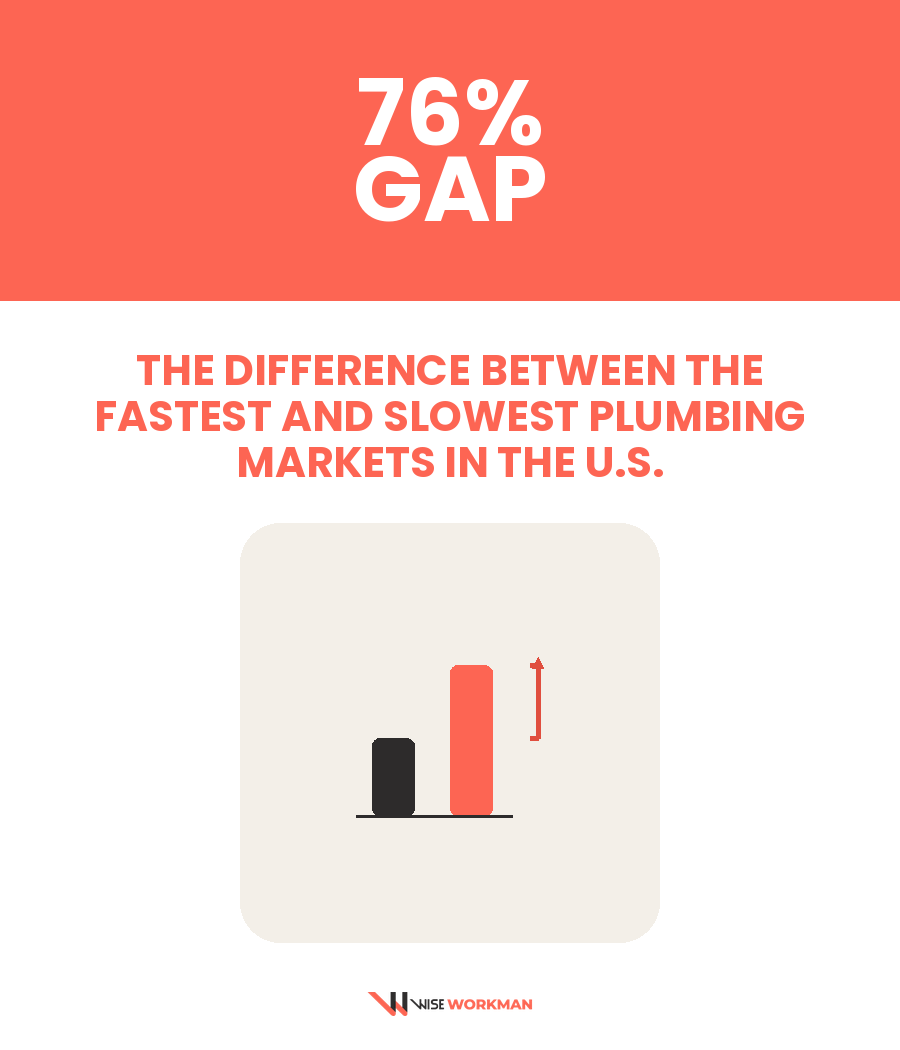
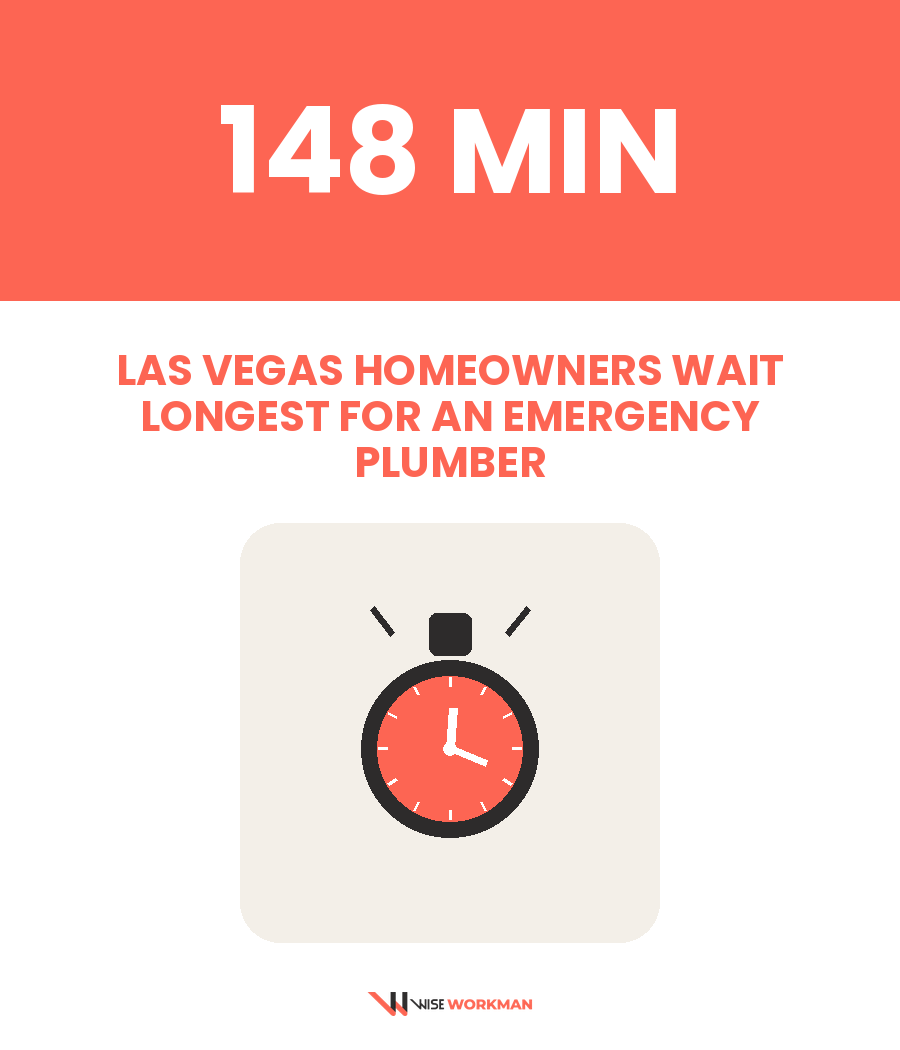
Across 15 major U.S. metros on the Wise Workman network, average emergency response ranges from 84 minutes in Charlotte to 148 minutes in Las Vegas, a 76% gap between our fastest and slowest markets. If you're calling from Vegas, "on the way" can mean nearly two and a half hours on your knees under the sink.
Here's who's fastest, who's slowest, what happens everywhere once peak hours hit, and what's actually driving the difference.
What We Actually Measured: No Surveys, No Guesswork
Every number below comes from completed service requests on our own network. Not a survey. Not an estimate. Four metrics, defined plainly:
- Avg. Emergency Response: average time from request to arrival for jobs flagged urgent, across all hours of the day.
- % Waiting 2+ Hours: the share of emergency requests where the customer waited two hours or longer.
- Avg. Peak-Hour Response: average arrival time for emergency requests placed during that market's own highest-demand window.
- Delay Score: our composite 0–100 score blending the three metrics above into a single ranking, where higher means a slower, more strained market.
Fifteen metros, ranked worst to best.
Charlotte, NC Has the Fastest Plumber Response Time, While Las Vegas Is the Slowest
| Rank | City | Avg. Emergency Response | % Waiting 2+ Hrs | Avg. Peak-Hour Response | Delay Score |
| 1 | Las Vegas, NV | 148 min | 42% | 181 min | 91.4 |
| 2 | Phoenix, AZ | 139 min | 38% | 169 min | 88.7 |
| 3 | Houston, TX | 132 min | 36% | 164 min | 86.9 |
| 4 | Los Angeles, CA | 127 min | 34% | 158 min | 84.8 |
| 5 | Miami, FL | 121 min | 31% | 149 min | 82.6 |
| 6 | Dallas, TX | 116 min | 29% | 143 min | 79.8 |
| 7 | Atlanta, GA | 112 min | 27% | 139 min | 77.5 |
| 8 | Orlando, FL | 109 min | 26% | 136 min | 75.9 |
| 9 | San Antonio, TX | 104 min | 24% | 129 min | 73.4 |
| 10 | Tampa, FL | 101 min | 23% | 125 min | 71.8 |
| 11 | Chicago, IL | 98 min | 21% | 121 min | 69.5 |
| 12 | Denver, CO | 94 min | 20% | 117 min | 67.2 |
| 13 | Philadelphia, PA | 91 min | 19% | 113 min | 65.7 |
| 14 | New York City, NY | 88 min | 18% | 111 min | 63.9 |
| 15 | Charlotte, NC | 84 min | 16% | 104 min | 61.2 |
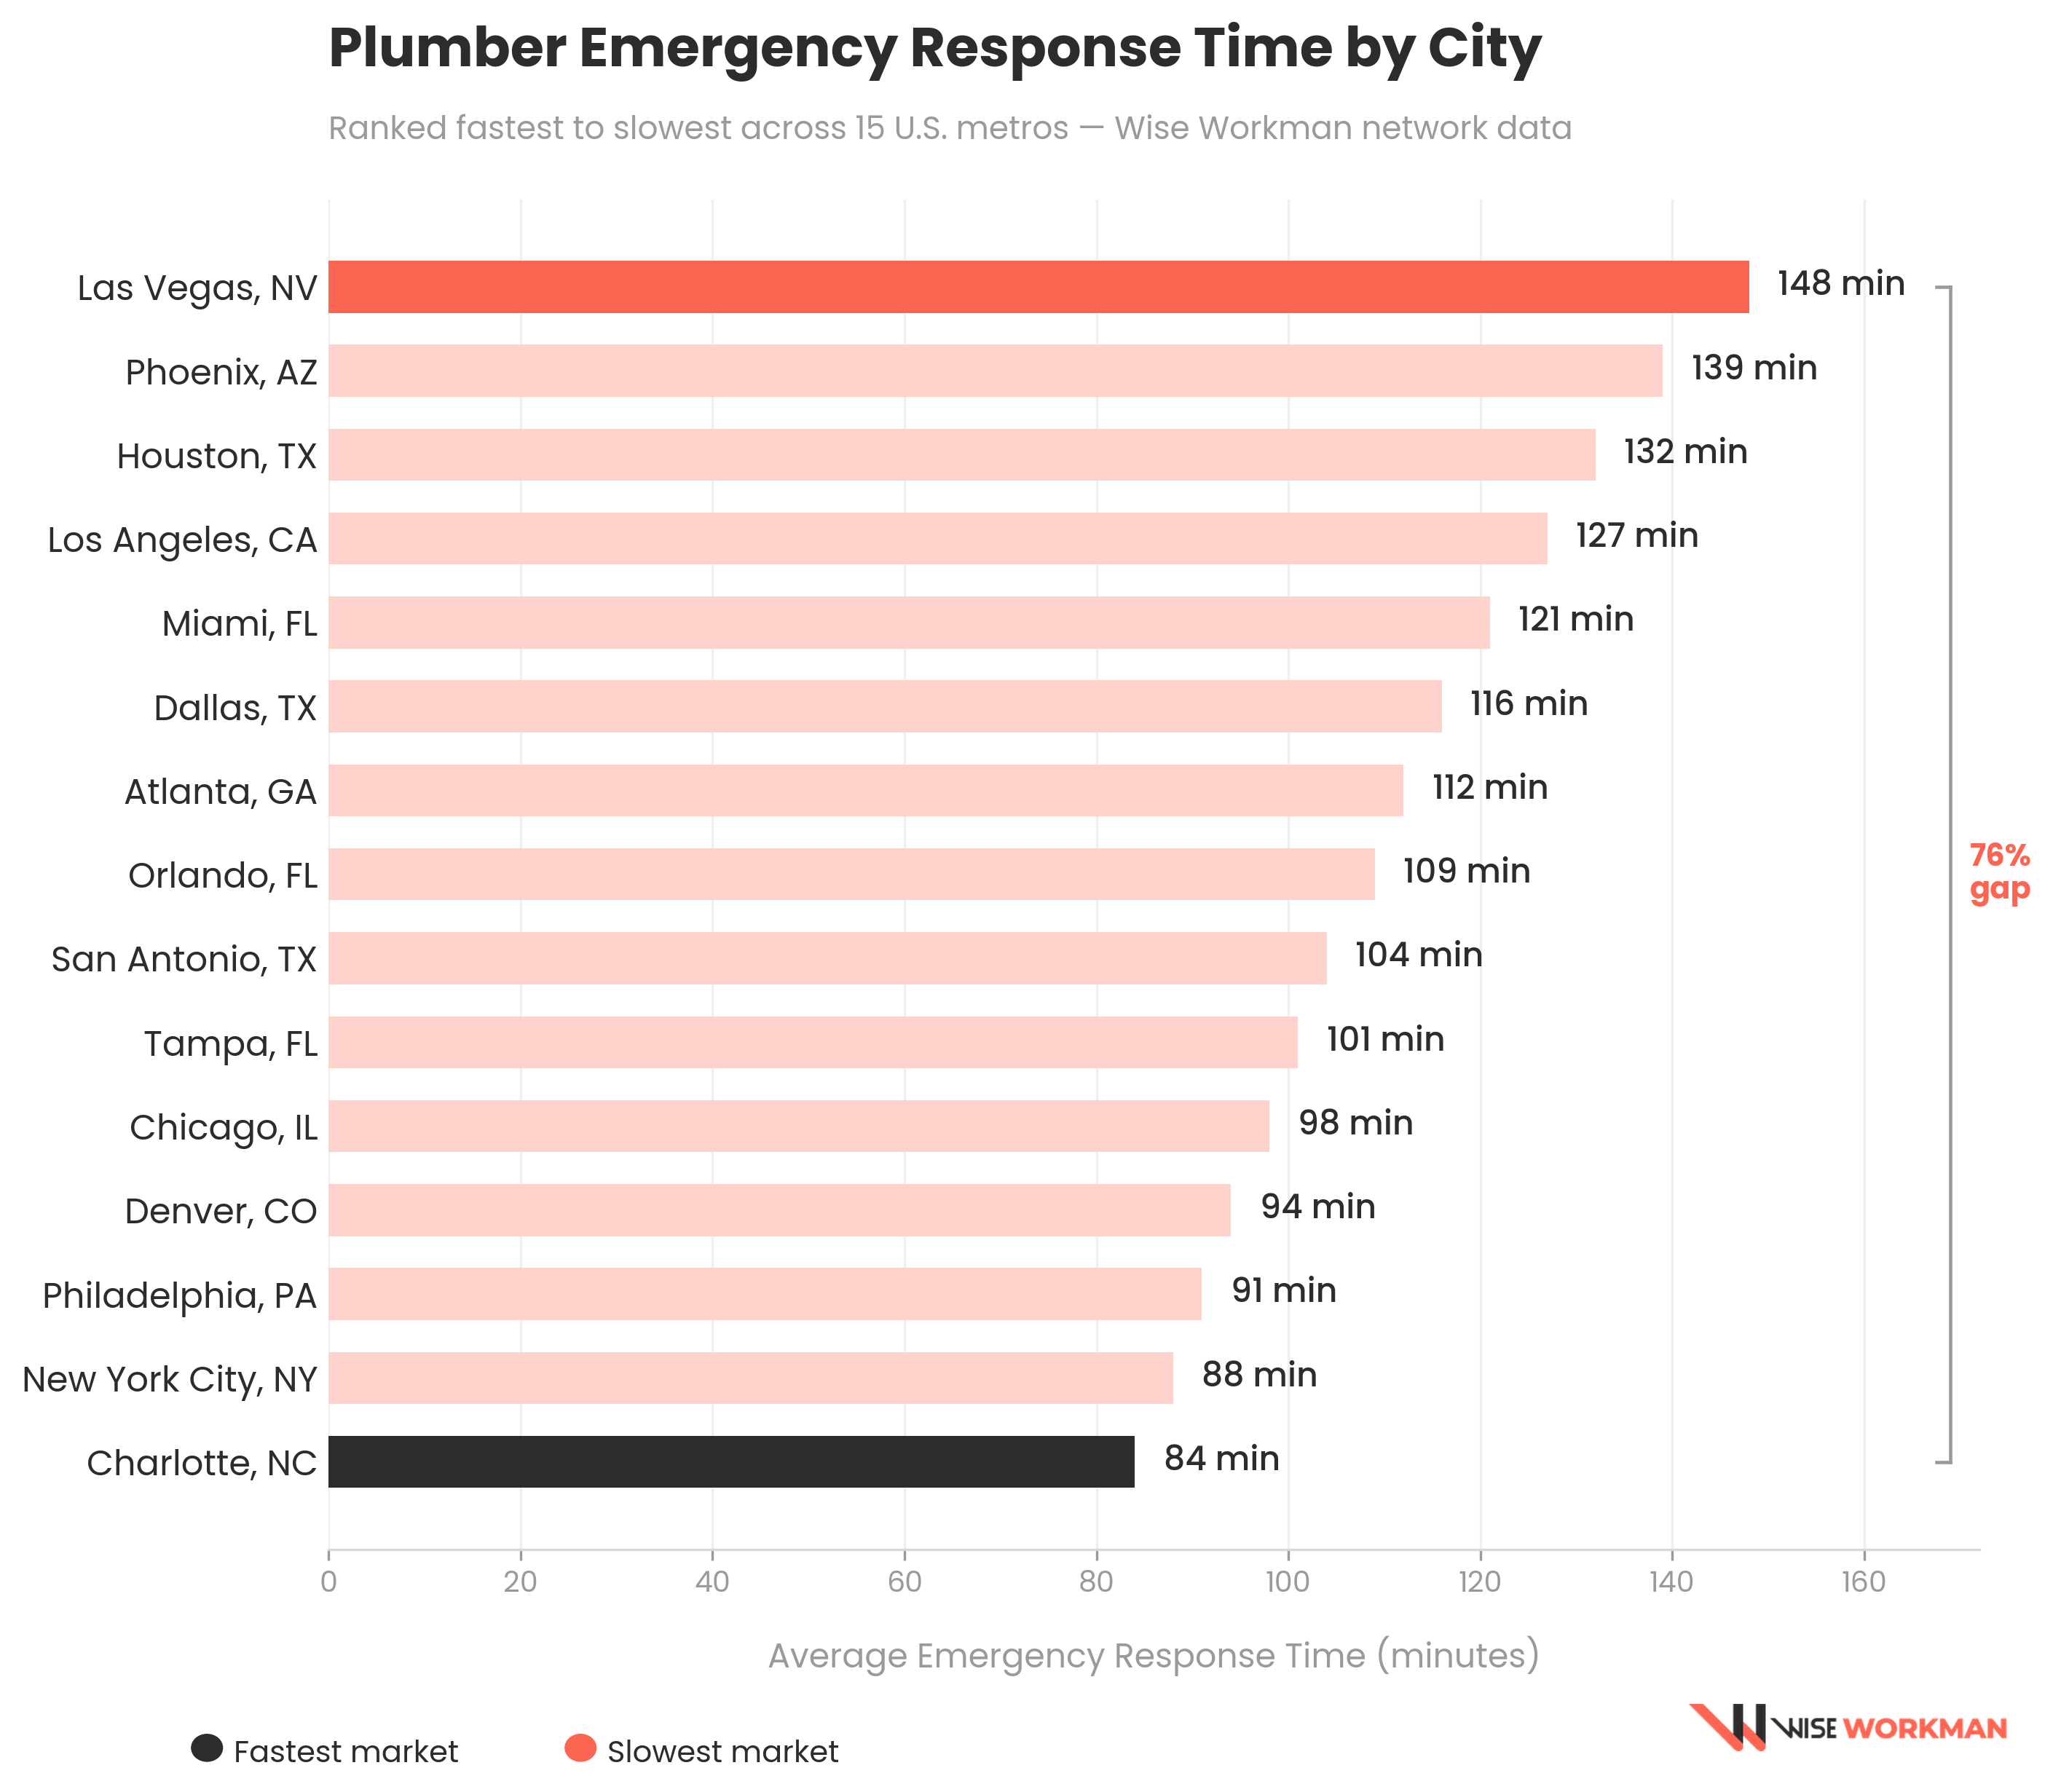
Las Vegas doesn't just have a slow average. It loses on all three fronts at once: the longest baseline wait, the highest share of customers stuck past the two-hour mark, and the worst peak-hour number on the list. There's no single bad metric dragging the city down; it's slow everywhere you look.
Charlotte, on the other end, backs up something we've seen elsewhere too. Independent research on water-main age and pipe material has separately ranked Charlotte among the least-strained plumbing markets in the country for reasons that have nothing to do with the data we collect ourselves. When two unrelated datasets land in the same place, that's usually a sign the number is real, not noise.
Las Vegas Homeowners Are 2.5x More Likely to Wait Over Two Hours Than Charlotte's
An average tells you what a typical wait looks like. It doesn't tell you how often things actually fall apart for someone. That's what the two-hour-plus number is for, and it's the more visceral read of the two.
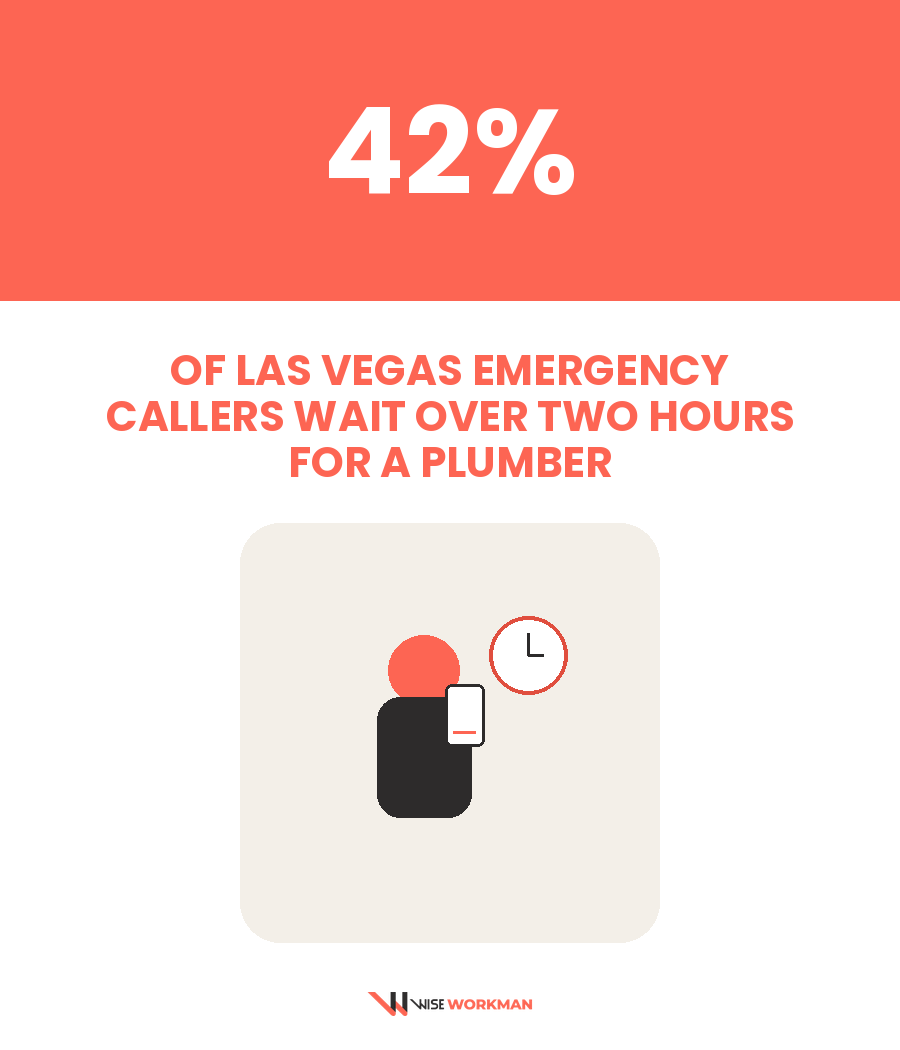
In Las Vegas, 42% of emergency callers waited two hours or more. In Phoenix, it was 38%. In Houston, 36%. Compare that to Charlotte's 16%, or New York's 18%, and the story stops being "what's the average wait" and becomes "what are the odds your bad day turns into a very long one."
The gap isn't subtle. A homeowner in Las Vegas is roughly two-and-a-half times more likely to wait two-plus hours for an emergency plumber than a homeowner in Charlotte. Same country, same trade, wildly different odds depending on your ZIP code.
Every Metro Gets About 24% Slower During Its Own Peak Hours
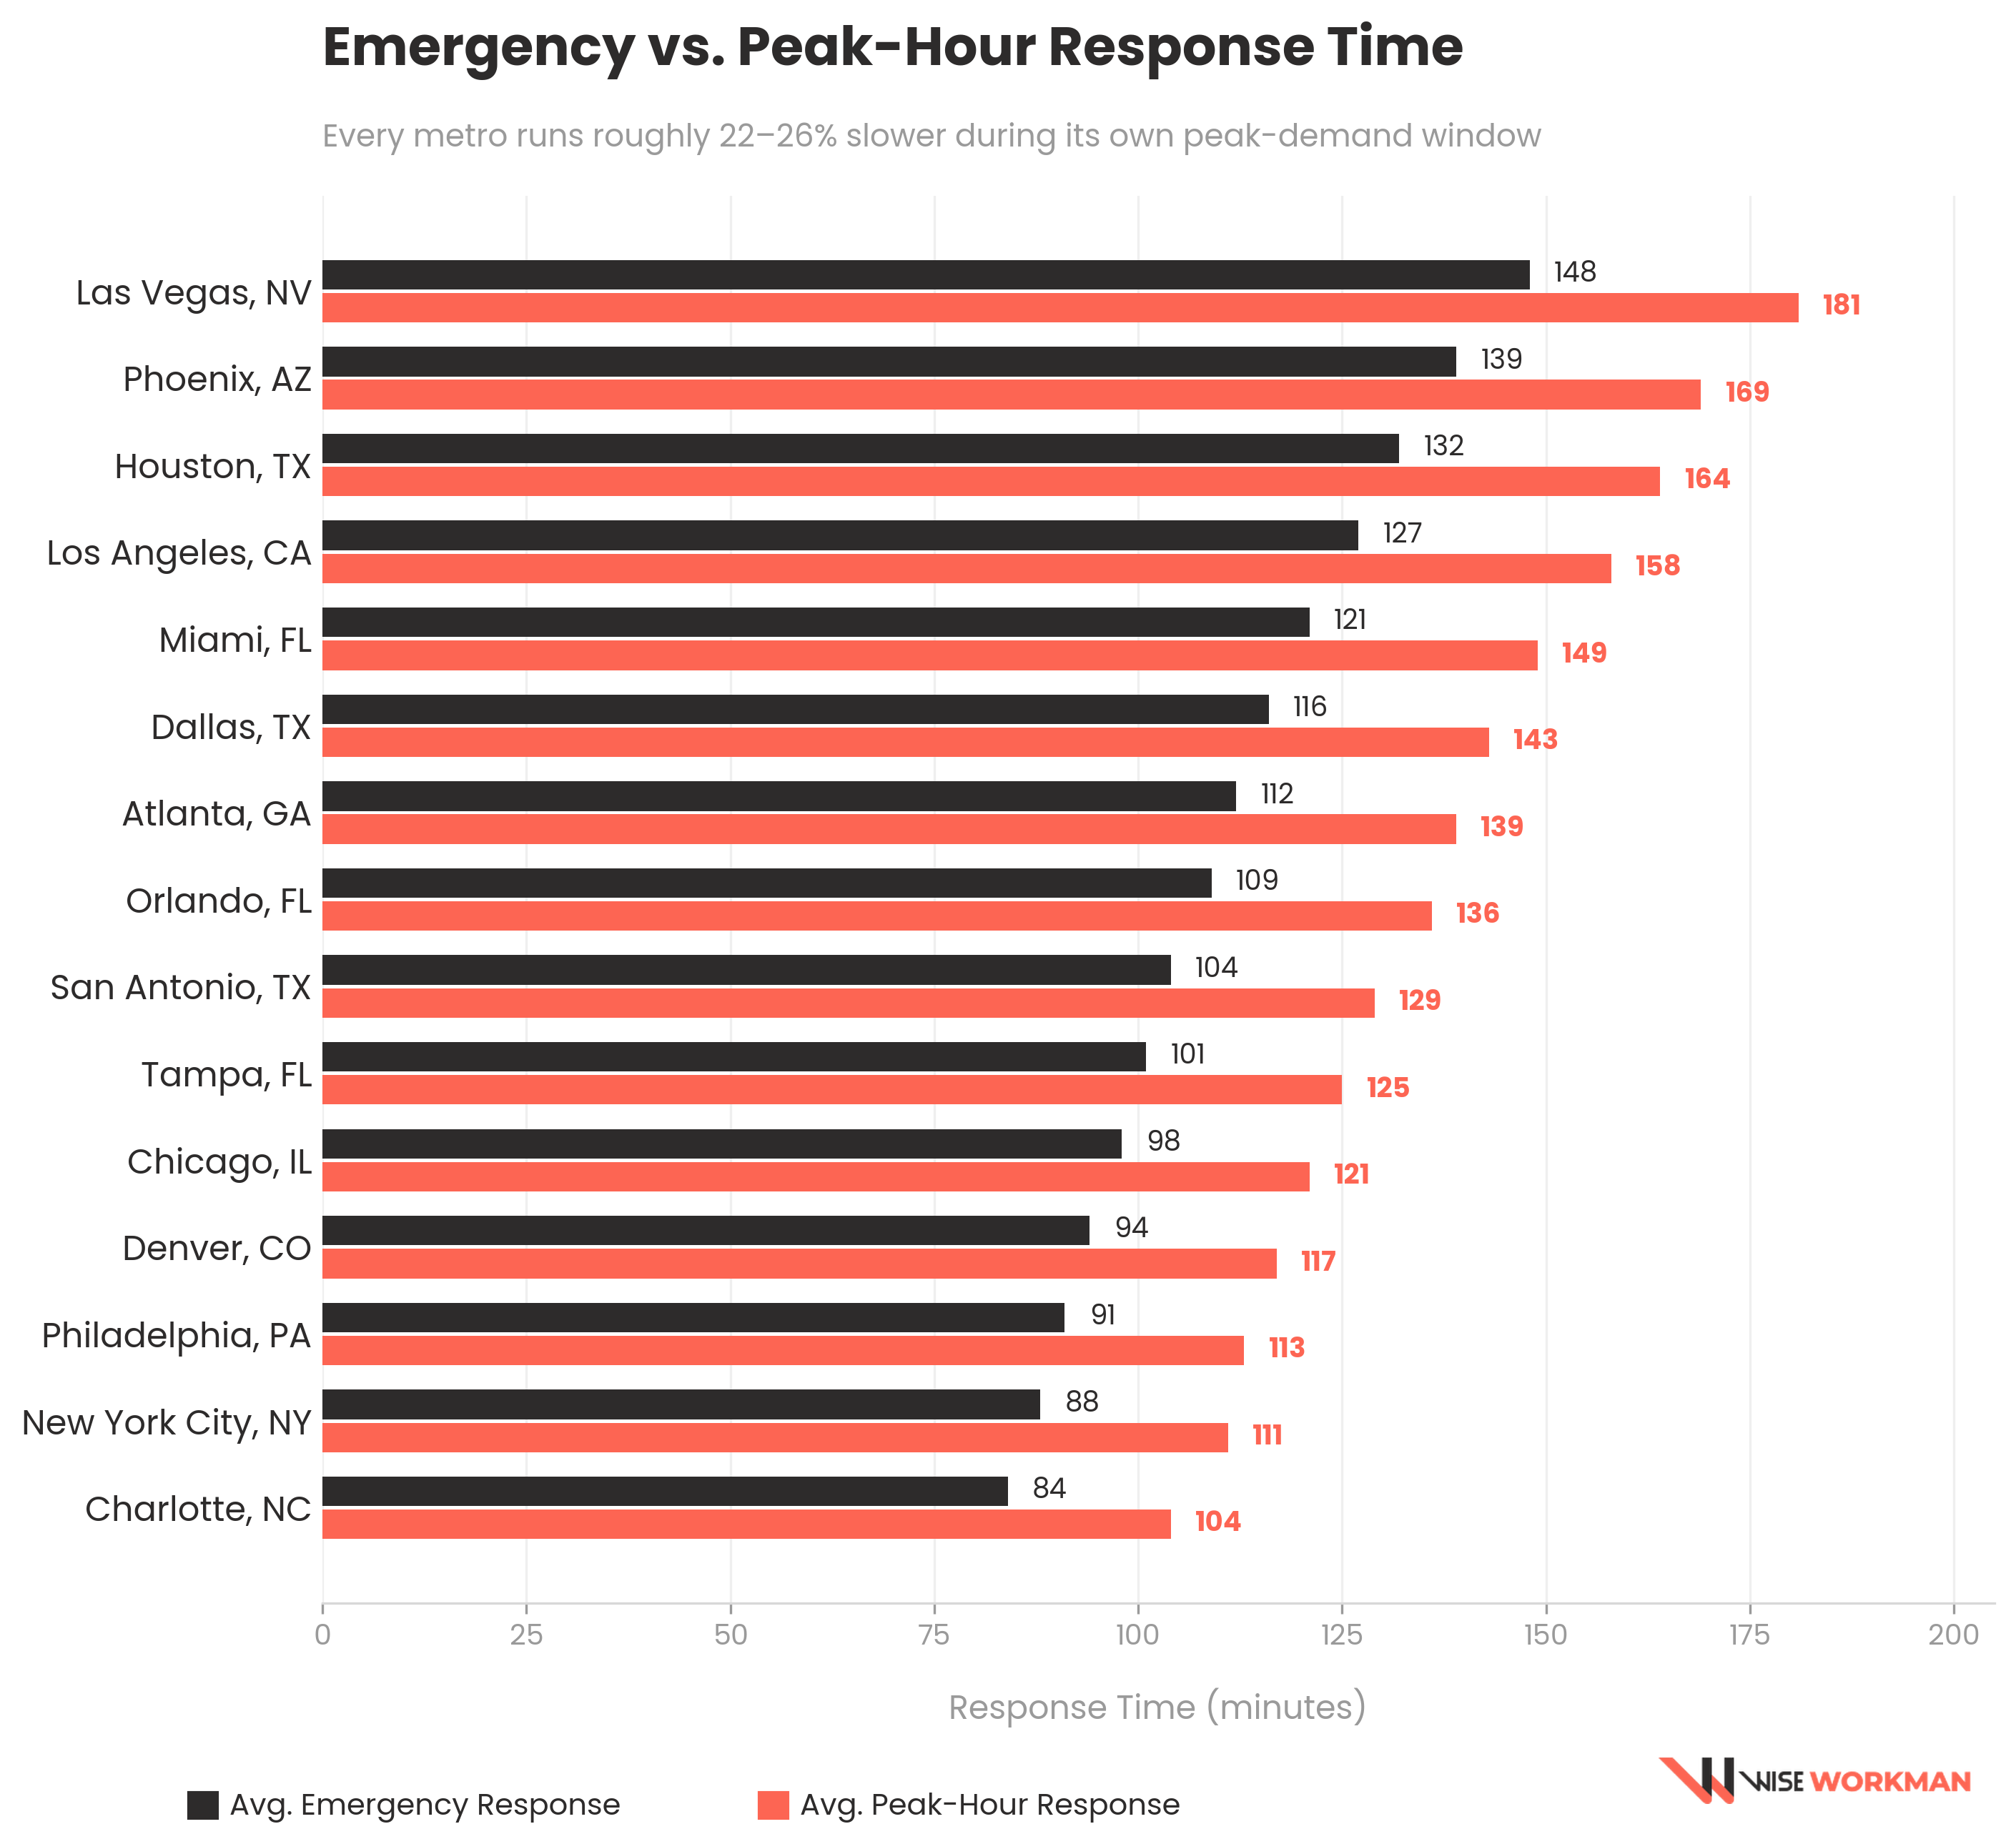
Here's the part that surprised us most: every single metro in the data slows down during its own peak-demand window, and the slowdown lands in almost the same range everywhere, roughly 22% to 26% longer than the standing emergency average.
Phoenix goes from 139 minutes to 169. New York goes from 88 to 111. The floor is different in every city. The tax you pay for calling during the busy window isn't.
That consistency is the real finding here. Peak-hour slowdown isn't a big-city problem, and it isn't a Sun Belt problem. It's a structural feature of how plumbing demand clusters during the day, and it shows up in every market we looked at, no matter how fast or slow that market runs on average.
We Can't Say Yet Whether a Faster Response Means a Better Rating
We'd love to end this section with a clean answer. We can't, not honestly. This pull tracks dispatch timing, not the review a customer leaves afterward, and we haven't joined those two datasets yet.
What we can say: service-industry research consistently ranks responsiveness among the top drivers of customer satisfaction, and plumbing would be a strange trade to break that pattern. Whether Las Vegas homeowners rate their plumbers lower than Charlotte homeowners rate theirs purely because of the wait is a real, answerable question. Once we join response and rating data at the individual-pro level, we'll have it. That's the analysis behind how the WW Score gets calculated, and it's the natural next pull from this same dataset.
Buffalo and St. Louis Are Sitting on the Most Pipe-Stressed Infrastructure in the Country
Our own network doesn't track what's buried under the street, so for this one, we're leaning on the public record. Cast iron mains installed before 1960 fail at nearly ten times the rate of modern PVC, and 86% of the cast iron still in the ground today is more than 50 years old, according to a 2023 Utah State University study covering roughly 400,000 miles of pipe across 802 utilities.
Buffalo is the extreme case nationally. Average home age: 82 years. 61% of housing built before 1939, sitting on cast-iron mains, in a region where the water main break rate hits 16.4 per 100 miles per year, more than three times the Pacific Northwest's 4.2. St. Louis isn't far behind, with a 79.3-year average home age and 58% pre-1939 housing, per Roto-Rooter's 2026 Plumbing Risk Index.
Cold makes all of it worse. Water expands about 9% when it freezes, and the circumferential cracking that follows is the single leading cause of water main failure nationally, responsible for close to half of all breaks. Worth flagging: neither Buffalo nor St. Louis shows up in our own 15-metro response-time ranking above, so treat this as a separate, complementary risk factor rather than a direct explanation for those rankings.
The Monday Before Thanksgiving Is Busier Than Black Friday Itself
Same caveat as the section above: this is public data, not our own network pull, since seasonality wasn't part of this export.
Ask anyone in the trade, and they'll tell you the same thing: the day after Thanksgiving is brutal. "Brown Friday" isn't a myth; Roto-Rooter has clocked roughly a 50% jump in call volume that day over an average Friday, and a 21% bump across the full four-day weekend, as grease, food scraps, and a house full of guests overwhelm kitchen drains and disposals nationwide.
But the popular version undersells it. ServiceTitan's analysis of data from more than 350 plumbing businesses since 2018 found the Monday before Thanksgiving runs about 80% busier than a typical post-holiday Friday, and the Monday after is busier still, around 85%. Both Mondays outpace Brown Friday itself. The holiday rush isn't one bad day. It's a week-long surge that peaks on the days nobody's making jokes about. Winter cold snaps add a second, sharper spike, especially in cities that rarely see a hard freeze, and whose pipes were never built for one, the way the Deep South found out in February 2021, and has found out again in smaller cold snaps since.
Five Ways to Get a Faster Response, No Matter Where You Live
- Know where your city sits on the list above. If you're in one of the eight slowest metros, treat same-day emergency service as a best case, not a guarantee, and plan around a 20-plus-minute peak-hour tax on top of the baseline.
- Vet a plumber before you need one. Waiting for the pipe to burst before you start searching means you're competing with everyone else calling in at the same moment. A pro you can call by name skips the search entirely.
- Know your main shutoff valve. It won't fix anything, but stopping active water damage buys you real time, no matter how far out help is.
- Say what's actually happening. "Water's pouring out from under my sink" gets triaged differently than "my sink's acting up." Be specific, not polite.
- Avoid non-urgent scheduling during known crunch windows. Thanksgiving week, a forecasted freeze, or your city's own peak-demand hours, if you know them.
Response Time Is a Structural Problem, Not a Luck Problem
If you live in Las Vegas, Phoenix, or Houston, a slow-feeling response isn't a reflection of the plumber you called. It's the market you're calling into, and now there's real data behind that. Homeowners there are stacking a longer baseline wait, a higher chance of a two-hour-plus delay, and the same peak-hour tax everyone pays, all on top of each other.
That's part of why the WW Score looks at how individual plumbers actually perform in responsiveness, communication, and outcomes instead of just where they happen to be located. A homeowner in a slower market like Las Vegas or Phoenix can still find out exactly which local pros consistently beat the market average. Compare licensed plumbers near you on Wise Workman to see how pros in your market stack up.
Frequently Asked Questions
Why does my wait for an emergency plumber vary so much depending on where I live?
It comes down to the ratio of active plumbers to demand in a given market, plus how spread out that demand is across the day. Fast-growing Sun Belt metros like Las Vegas, Phoenix, and Houston often have housing growth outpacing the local trade workforce, so more emergency calls are competing for the same pool of technicians. Denser or slower-growing markets like Charlotte or New York tend to have a better-matched supply of plumbers to demand, which shows up directly in shorter average waits.
What actually counts as an "emergency" call versus a regular appointment?
Most plumbing companies flag a call as an emergency when there's active water damage or a safety risk: a burst pipe, a major leak, no water at all, or a sewage backup. Slow drains, dripping faucets, or a running toilet usually get scheduled as standard appointments, even if they feel urgent to the homeowner. If you're not sure which category your issue falls into, describe the problem specifically when you call; "actively flooding" gets triaged very differently than "acting up."
Why is Las Vegas the slowest market for plumber response times?
It's not one factor; it's several stacking on top of each other. Las Vegas has the longest baseline average wait, the highest share of customers stuck past two hours, and the worst peak-hour number of any metro measured. Rapid population growth, a high volume of short-term rental and hospitality plumbing demand, and extreme summer heat that stresses pipes and water heaters all likely contribute to a workforce that's stretched thinner relative to demand than in most other cities.
If I live in a slow-response city, is there anything I can actually do about it?
A few things help. Vet and save the contact for a plumber before you have an emergency, since searching from scratch during a crisis means competing with everyone else calling at the same moment. Know where your main shutoff valve is; it won't fix the problem, but it buys you time no matter how long the wait is. And avoid scheduling non-urgent work during known high-demand windows, like the week of Thanksgiving or a forecasted cold snap, since response times slow down even further during those stretches.
Does paying extra for "priority" or "same-day" service actually get a plumber there faster?
Generally yes, though how much faster varies by company. Priority fees typically move your job ahead of standard-queue requests, and some companies keep an on-call technician specifically reserved for premium-tier emergencies. It's worth asking upfront what the fee guarantees: a specific time window, or just a queue-jump since "priority" isn't a standardized term across the industry.
Why do response times get worse during certain hours of the day, even in fast cities?
Every market in this data slows down by roughly 22–26% during its own peak-demand window, regardless of how fast or slow that city runs on average. That's because plumbing demand naturally clusters mornings when people first notice an issue, evenings after work, and weekends when people are home to notice a problem. During those windows, the same number of technicians are covering a spike in calls, so wait times climb even in markets that are otherwise quick to respond.
Is it true that the day after Thanksgiving is the busiest day for plumbers?
It's busy, but it's not actually the busiest. "Brown Friday" gets the reputation because of the roughly 50% jump in call volume it sees over a typical Friday, driven by kitchen drains overwhelmed by holiday cooking. But industry data covering hundreds of plumbing businesses shows the Monday before Thanksgiving and the Monday after are both busier still, around 80–85% above a normal post-holiday Friday. The rush is really a full week, not a single day.
Does the age of a city's water infrastructure actually affect how often I'll need an emergency plumber?
Yes, in aggregate. Cast iron water mains installed before 1960 fail at nearly ten times the rate of modern PVC, and cities with older housing stock like Buffalo and St. Louis, where more than half the homes predate 1939, see higher water main break rates than newer metros. That said, infrastructure age is a separate factor from response time; a city can have old pipes and still respond quickly, or vice versa, since response time is driven by workforce supply, not pipe material.
Does cold weather really make plumbing emergencies worse, or is that overstated?
It's understated, if anything. Water expands about 9% when it freezes, and the cracking that causes is the single leading cause of water main failures nationally, responsible for close to half of all breaks. The effect is often worst in places that rarely see hard freezes, since homes and pipes there weren't built with the same cold-weather protections as northern cities, which is part of why an unusual cold snap in a warm-climate region can overwhelm local plumbers fast.
What's a reasonable wait time to expect for an emergency plumber?
It depends heavily on your city, but as a rough benchmark, average emergency response across 15 major U.S. metros ranges from about 84 minutes to 148 minutes. If you're waiting well beyond your local average, especially outside of a known peak-demand window, it's reasonable to call and ask for a status update, or to check whether a faster-responding provider is available.
Does a faster response time mean a plumber will actually do better work?
There's no confirmed link yet between how fast a plumber arrives and the quality of their work or the rating they receive. Response time and job quality are typically tracked separately, and few sources have published data joining the two. That said, general service-industry research consistently shows responsiveness and communication rank among the top drivers of customer satisfaction, so a fast, well-communicated arrival likely helps the overall experience even if it doesn't guarantee the repair itself is better.
How do plumbing companies measure "response time" in the first place, and is it consistent across companies?
Not always; some companies measure from when the customer calls, others from when the job is officially dispatched to a technician, which can create a gap of several minutes before the clock even starts. When comparing response-time claims between providers, ask specifically what's being measured: request-to-arrival is the most meaningful number for a homeowner, since it reflects the actual wait you'll experience.
Is it worth calling multiple plumbing companies at once during an emergency to see who arrives first?
It can shorten your wait, but it comes with trade-offs: some companies charge a dispatch or diagnostic fee even if you cancel once another plumber arrives first, and juggling multiple crews can create confusion about who's actually coming. A more reliable approach is having a vetted plumber's direct line saved before you need one, so you're not starting the search from zero the moment an emergency hits.